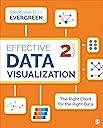
Effective Data Visualization: The Right Chart for the Right Data
Product ID: 155114324
Desertcart purchases this item on your behalf and handles shipping, customs, and support to British Virgin Islands.
NOW IN FULL COLOR! Written by sought-after speaker, designer, and researcher Stephanie D. H. Evergreen, Effective Data Visualization shows readers how to create Excel charts and graphs that best communicate their data findings. This comprehensive how-to guide functions as a set of blueprints―supported by both research and the author’s extensive experience with clients in industries all over the world―for conveying data in an impactful way. Delivered in Evergreen’s humorous and approachable style, the book covers the spectrum of graph types available beyond the default options, how to determine which one most appropriately fits specific data stories, and easy steps for building the chosen graph in Excel. Now in full color with new examples throughout, the Second Edition includes a revamped chapter on qualitative data, nine new quantitative graph types, new shortcuts in Excel, and an entirely new chapter on Sharing Your Data With the World , which provides advice on using dashboards. New from Stephanie Evergreen! The Data Visualization Sketchbook provides advice on getting started with sketching and offers tips, guidance, and completed sample sketches for a number of reporting formats. Bundle Effective Data Visualization, 2e , and The Data Visualization Sketchbook, using ISBN 978-1-5443-7178-8! Review: great informational book - I had to buy this book for a graduate-level statistics course. I thought it was kinda silly at first, but it has been a great tool. It has beautiful graphics with fantastic step-by-step instructions and explanations on the whats and whys of tables and figures. I've made some great infographics with the help of this book. Highly recommend for anyone who ever has to present data in some form of fashion. Review: I recommend - Very good resource. I have used it to produce visualizations for work products.
| Best Sellers Rank | #216,579 in Books ( See Top 100 in Books ) #24 in Social Sciences Research #54 in Running Meetings & Presentations (Books) #101 in Sociology Research & Measurement |
| Customer Reviews | 4.6 out of 5 stars 172 Reviews |
R**A
great informational book
I had to buy this book for a graduate-level statistics course. I thought it was kinda silly at first, but it has been a great tool. It has beautiful graphics with fantastic step-by-step instructions and explanations on the whats and whys of tables and figures. I've made some great infographics with the help of this book. Highly recommend for anyone who ever has to present data in some form of fashion.
A**R
I recommend
Very good resource. I have used it to produce visualizations for work products.
R**E
Great information
Has great infromation
J**A
Excellent Condition
Excellent
A**R
Very helpful
This book is a great resource. I need to manipulate data for work and present results in PowerPoint and didn’t have much experience. I’ve found this book very straightforward and well organized.
C**Z
Amazingly easy to follow and extensive
This book will help you to know not only when to use a specific chart but how to create them in a very user friendly format. Great for data analysis professionals.
C**O
Excellent guide to dashboard visuals
Practical guide to having an awesome dashboard
A**R
Useful
Good ideas, well written
S**E
A must buy for everybody who works in data visualisation.
This is probably the best book that I read about data visualisation. Straight to the point and very practical. Very, very practical. Covers what you need to shine in your company when it comes to visualisation.
A**X
Nicht in Farbe
Hatte das Buch schon bei einem Kollegen in der Hand und empfand es als gut. Also auch bestellt. Leider ist diese Version des Buches nur in Schwarz-Weiß. In der Beschreibung steht aber: "The Second Edition is also presented in full color."
G**K
Where has the colour gone?
I have just picked up the book and from reading the preface, I'm already disappointed. The preface mentions a quantitative and qualitative chart chooser on the inside covers - nothing in my copy of the book. It also states every image is now in full color - again, you can see from the video I've uploaded that each image inside the covers is in glorious black and white! So, this is not a great start. It has tainted my opinion before I've started reading, but hopefully my opinion may improve when I start reading it properly. Let's hope there aren't any more glaring omissions or mistakes.
N**L
Titel irreführend, sollte How to wirh Excel heissen
Was dieses Buch genau sein soll weiss ich nicht. Jedenfalls keines womit man eine konzeptionelle Sicht auf Visualisierung bekommt. Im Groben ist es ein "Wie baue ich Charts in Excel" Arbeitsbuch. Ist mir schleierhaft woher das Buch diese Rezensionen bekommen hat. Als ich den Herausgeber gesehen habe, war mir dann eh alles bewusst.
Trustpilot
2 weeks ago
3 days ago